
Comparative Industrial Energy Prices: Europe vs China and the USA (2008–2025)
The key report for understanding the impact of energy prices on EU industry and how it has stripped the European bloc of its competitiveness.

Industry end-user prices for electricity in selected countries, 2019-March 2023
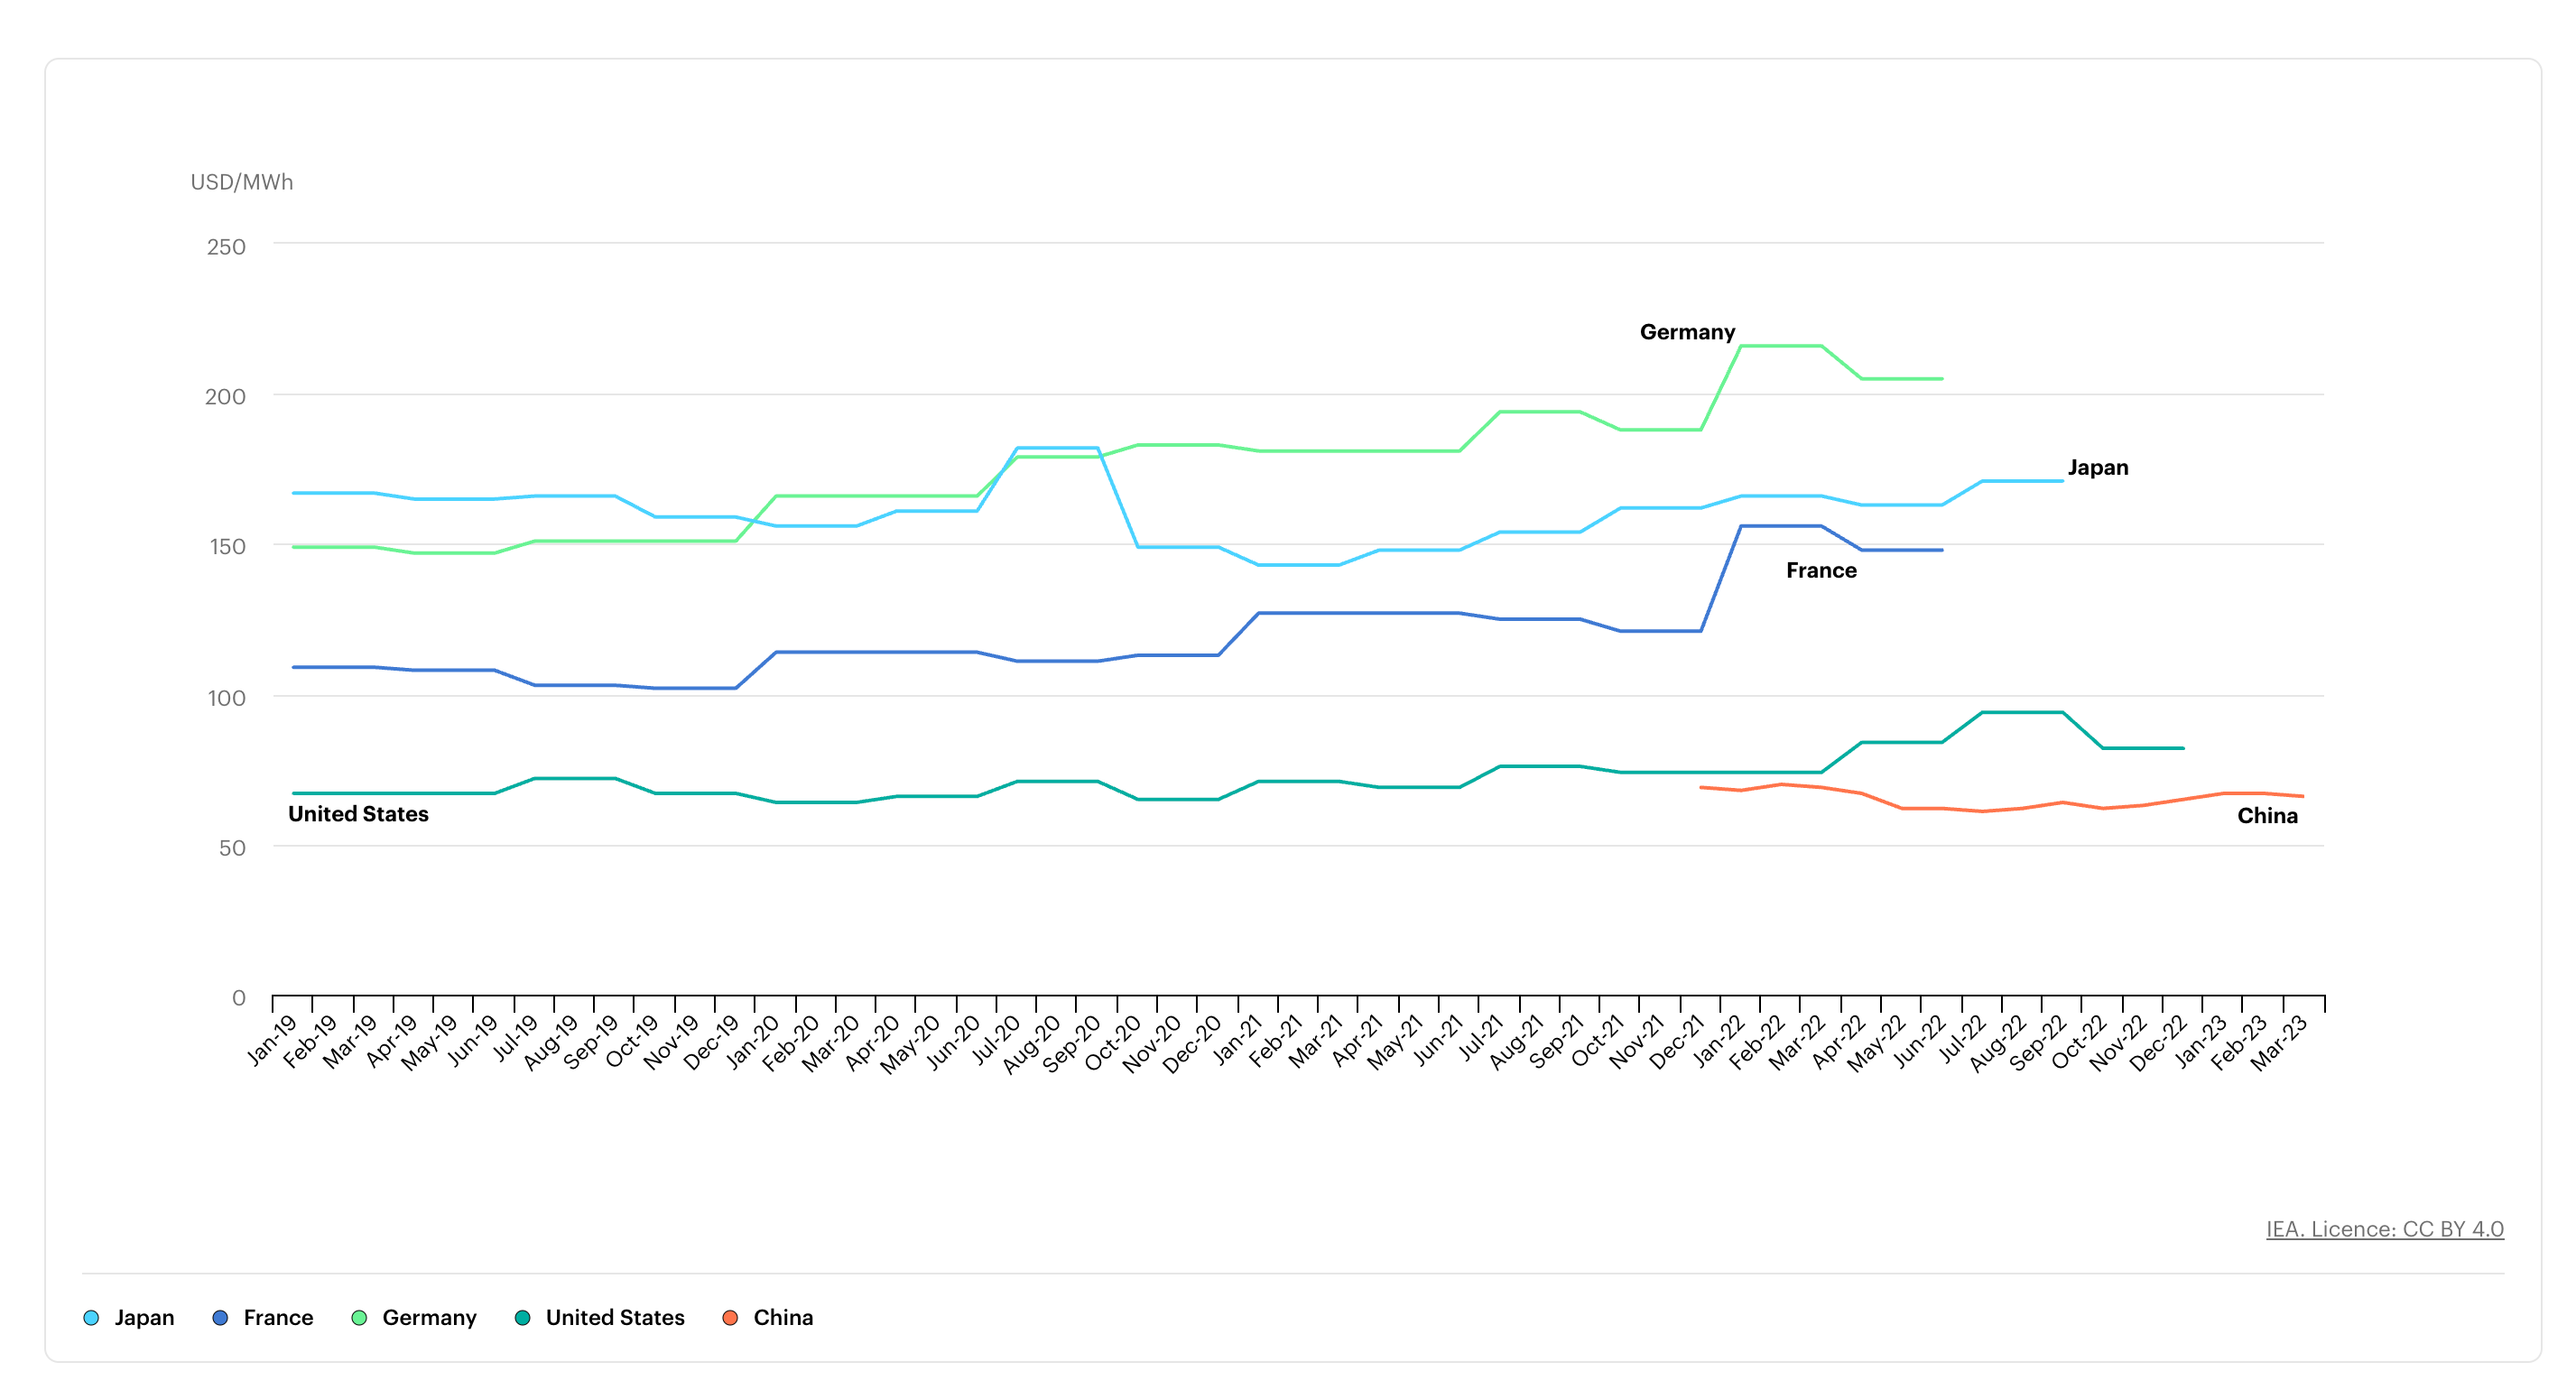
Industrial Energy Price Trends (2008–2025)
Industrial electricity prices for Europe, USA, and China from 2008–2025. Europe’s industrial power costs (blue) have risen significantly, especially after 2020, while the USA (red) and China (green) maintained comparatively stable, lower prices. The Y-axis is in USD per megawatt-hour (MWh). Higher values indicate more expensive energy.